June 29, 2020 in #coding
📈 dtxc launch day analytics
I did it, I successfully built and launched Daily Texas Country! But how do I determine success? I'm still not totally sure how to answer that question, but a good first step would be to track and understand our analytics. All of the statistics you see below are numbers from launch day, June 18.
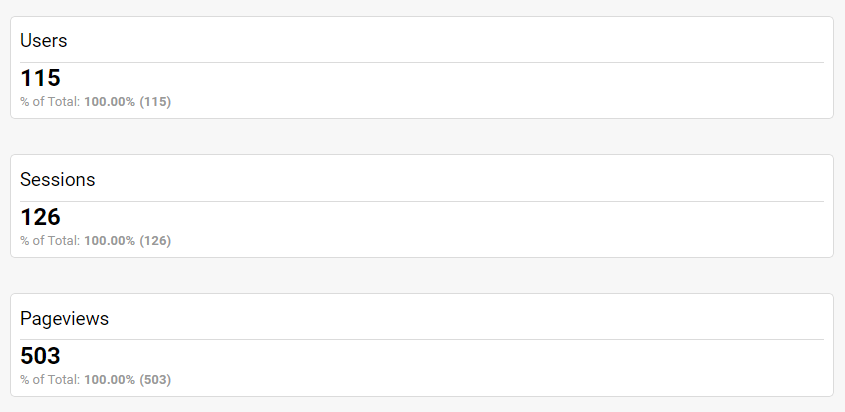
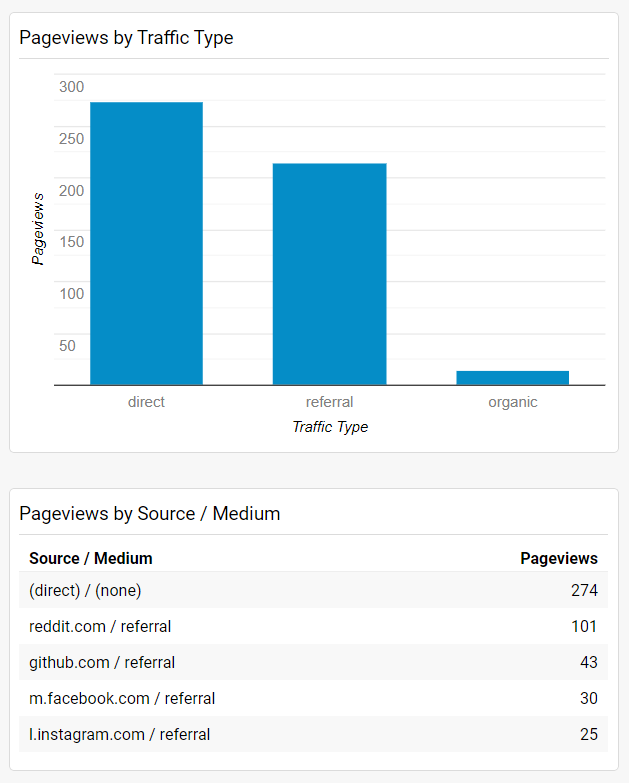
Leading up to the launch I did five days of marketing hype on Reddit, Twitter, Instagram, and Facebook. I've only got about 60 friends who are interested in this kind of music, so reaching 500 views proved that these marketing tactics actually worked. Specifically you can see that my posts in r/texascountry really helped, leading the list of referrals.
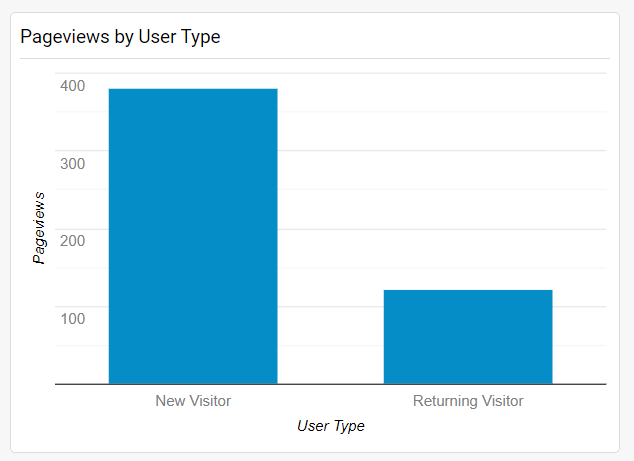
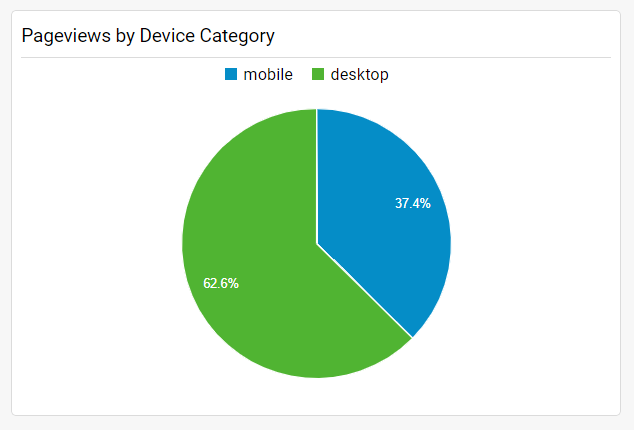
It's no surprise that the vast majority of the DTXC vistors were new users. I'd only mentioned the development website to a few developers and some close friends. But what did surprise me is the percentage of desktop views. I really thought this website would drive the most traffic from social media sources, which are primarily accessed on mobile phones.
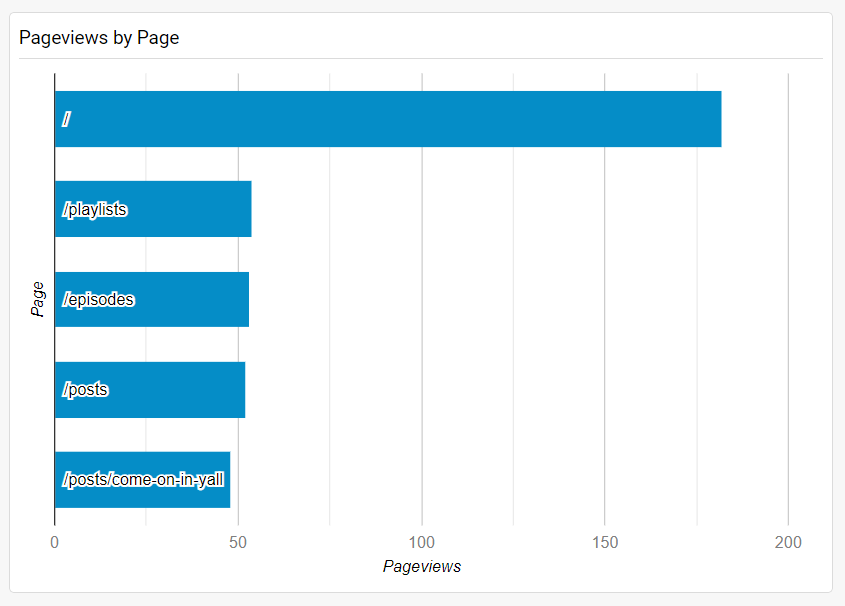
And finally, a list of the most popular pages. Obviously the home page came out on top, but it makes me happy to see that playlists and episodes ranked ahead of posts. Although posts take the most time and energy to create, playlists and episodes are the types of content that will keep visitors coming back to Daily Texas Country for a long time.
While these numbers didn't blow my mind, I'm very happy with the launch day statistics. My marketing efforts caused me to reach more people than just my own social network, and proved that Daily Texas Country is something people want! Keep your eyes on the site for more to come!