September 13, 2022 in #coding
🟢 profiling node scripts
If you're looking to improve the performance of a Node.js script, a flamegraph is a great way to visualize where time is spent during execution.
Node supports generating data from scripts that is required to create a flamegraph. To start profiling a script, run it with the inspect command to begin a debugging session.
node inspect index.jsYou'll see that Node starts an interactive debugging session, halted at the first line of your script. Here you can run the script as many times as you need with features like breakpoints and step by step execution. Type help at the debug> prompt to see all available options.
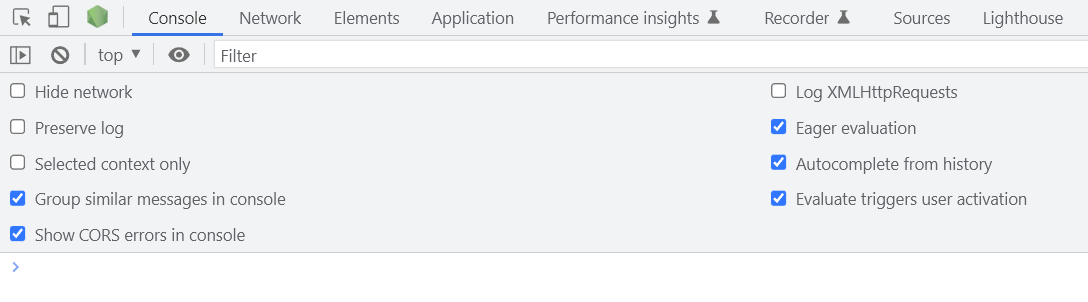
In order to view the flamegraph, open the Node.js DevTools in Chrome by clicking the green Node.js icon in the top left of the DevTools window. This will open open a window where you can select your JavaScript VM instance to record.
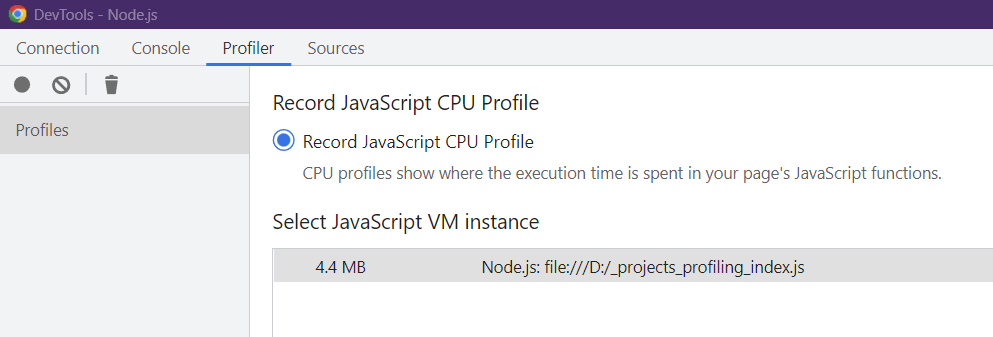
To begin profiling, click the blue Start button at the bottom of the Profiler tab. Then go to your terminal and type cont to continue your script execution. Once completed, go back to the Profiler tab and click Stop.
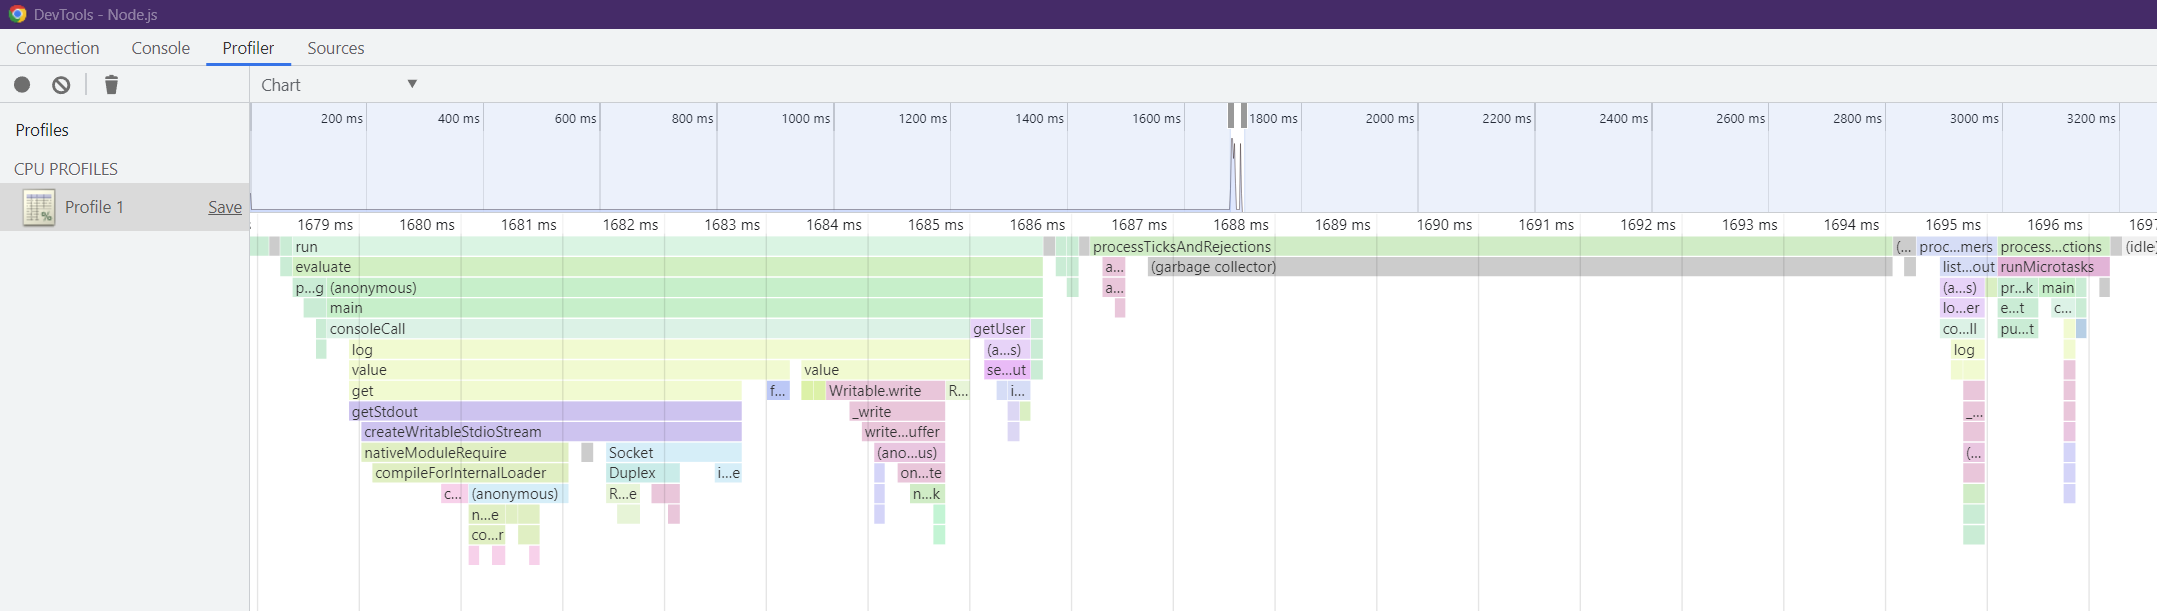
Then you'll see an interactive flamegraph that you can use to view which function calls took the most time during the execution. It can be viewed as a chart, a tree, or a list, but I prefer the chart.
Between each profiling run, you must clear all profiles in the Profiler tab and restart your Node debugger with the restart command. Then go back and select your JavaScript VM instance to begin profiling again.
While I found the restart process to be a little inconvenient, it was the most reliable way to get a profile capture across multiple runs of my script.